

Prediction markets’ midterm forecasts were broadly right, with notable misses
Politics · First reported 3 Nov, 22:45 · Updated 23:07
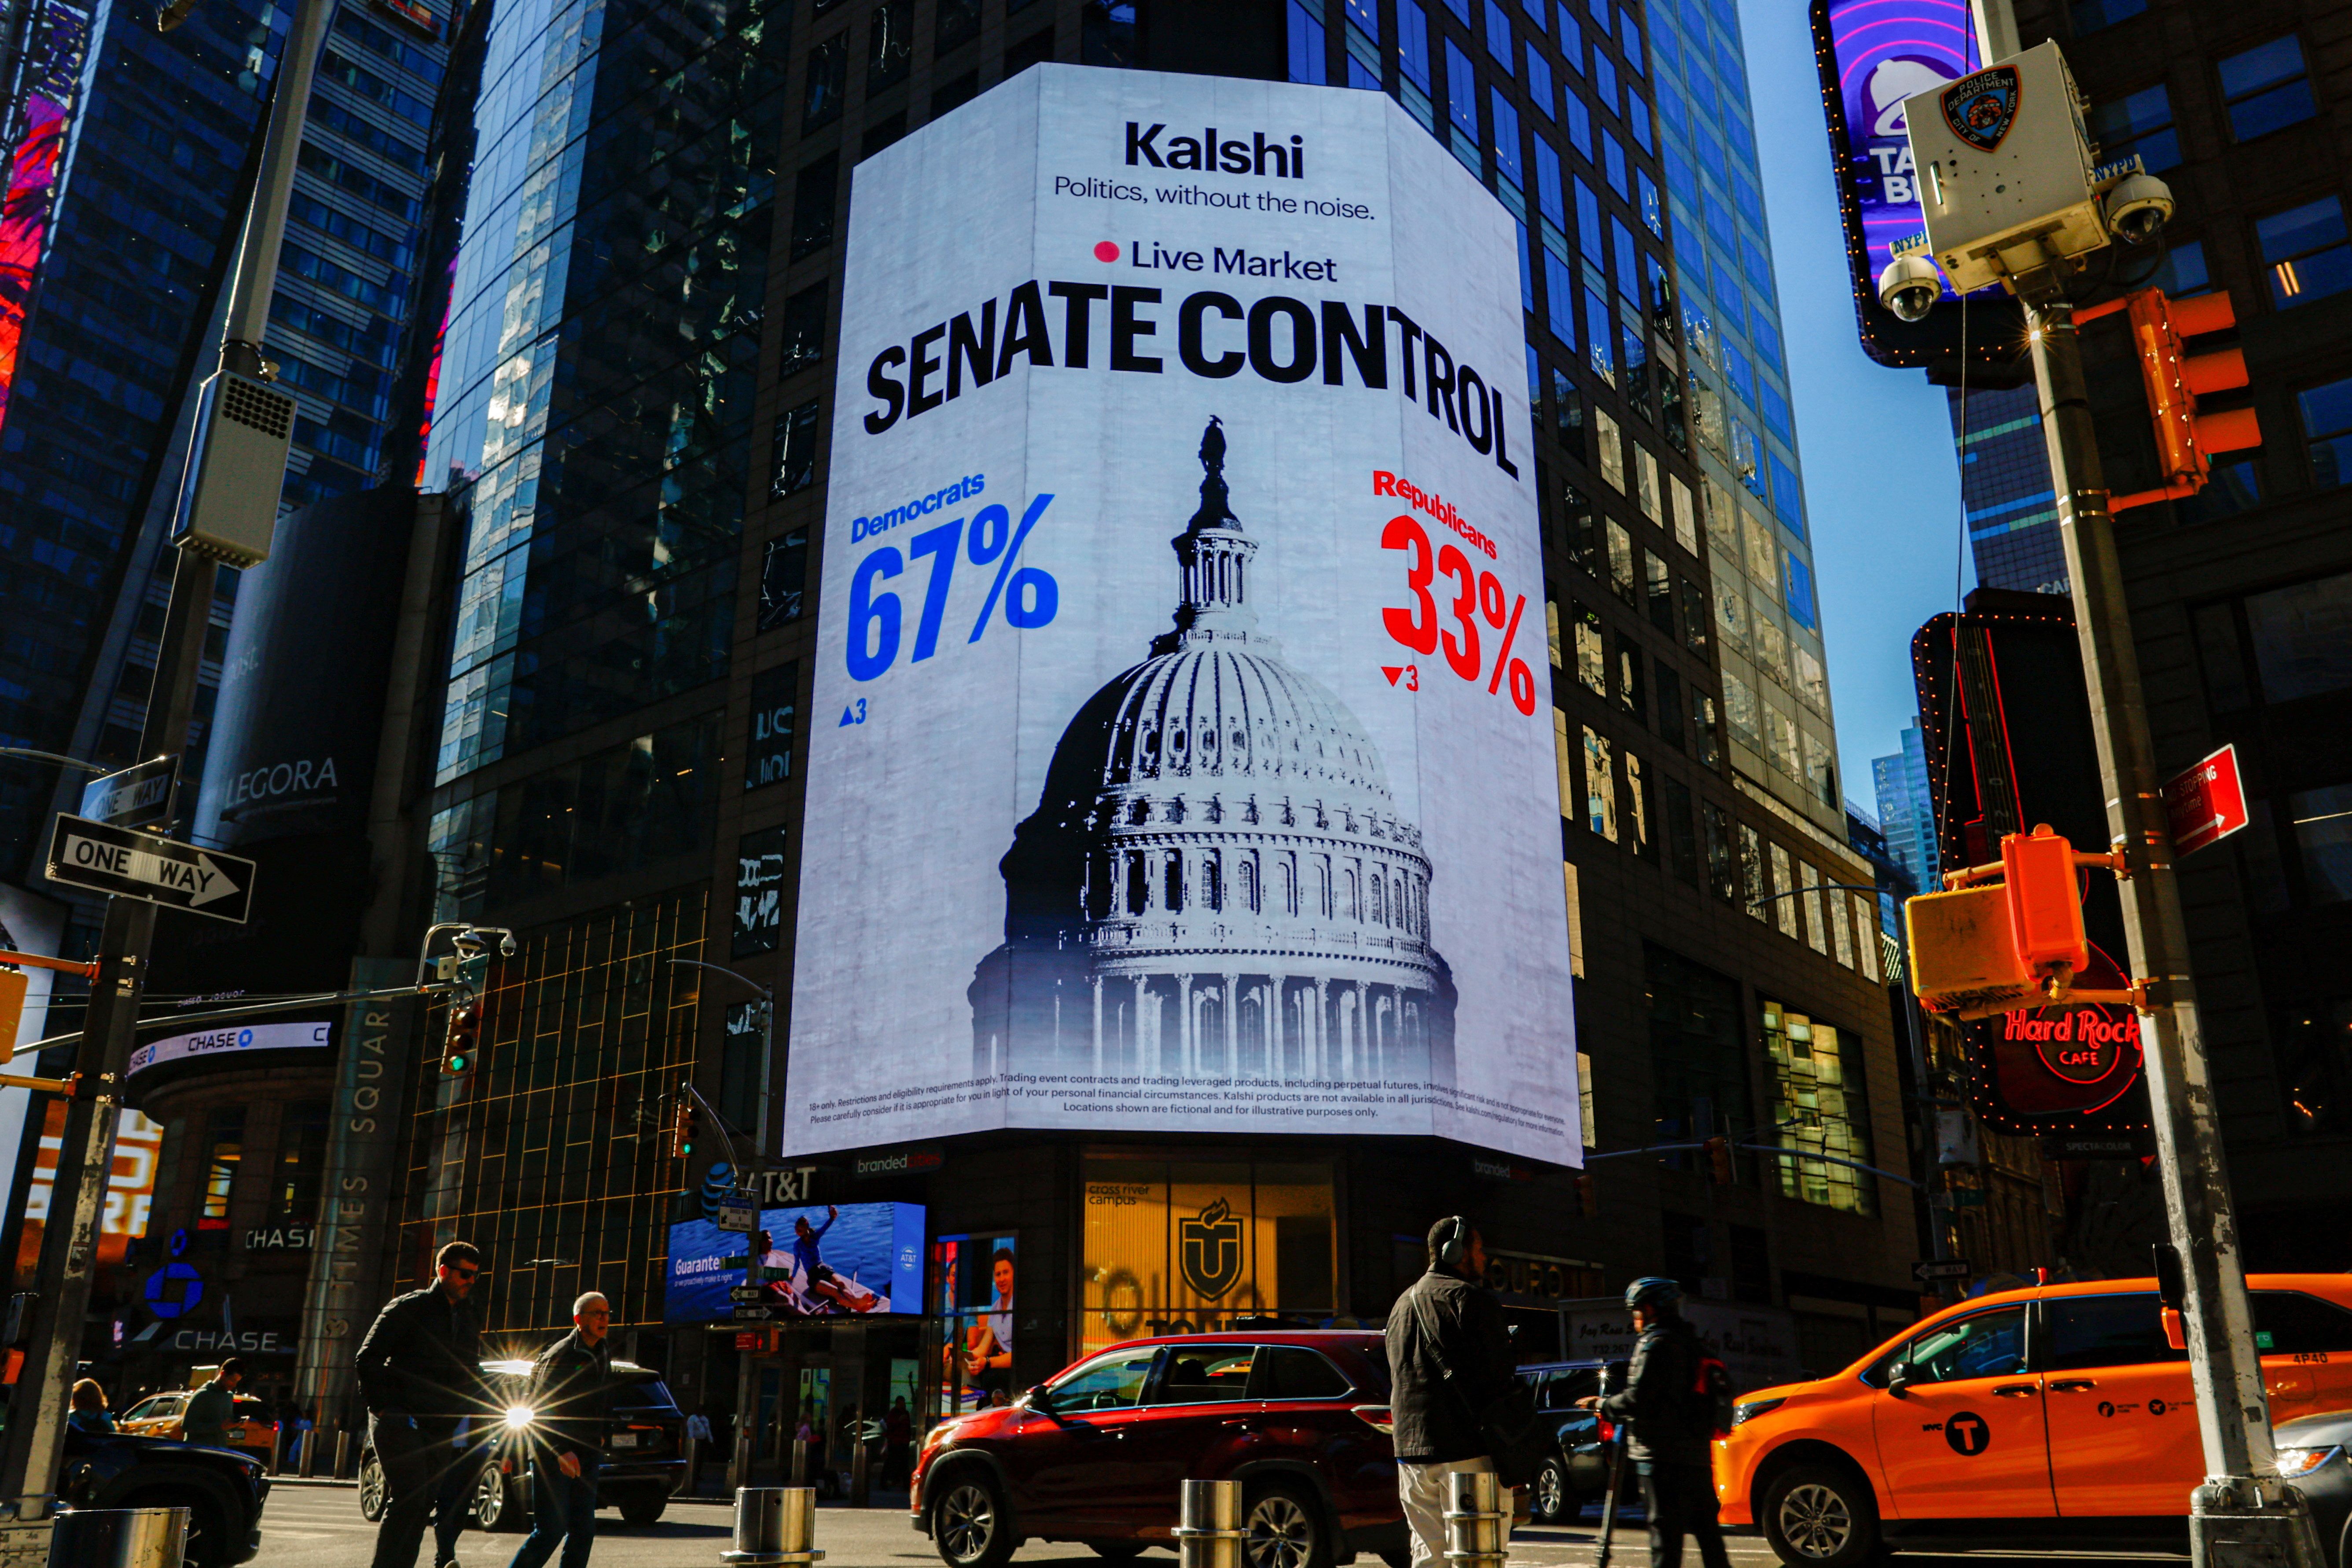
Kalshi and Polymarket signaled a Democratic sweep, but several races defied market expectations. Trading was substantial, while the results also underscored that market forecasts can be wrong.
- The markets broadly anticipated Democratic control of Congress, but missed some races, including South Carolina’s Senate contest.
- Semafor reported $1.8 billion in down-ballot trading, nearly five times the 2024 cycle’s volume; CNA reported more than $1.48 billion wagered on election day.
- CNA reported that Kalshi’s election-market volume exceeded $2.5 billion this cycle, compared with $1.3 billion in the 2024 election cycle.
- CNA noted that prediction-market odds can be affected by speculation, thin liquidity and concentrated bets, and that forecasts do not guarantee outcomes.
- The Straits Times reported that Polymarket and Kalshi said they had strengthened controls to guard against misconduct.
Summary written by Lux AI from 3 articles
Key facts
- Semafor-reported down-ballot volume
- $1.8 billion, nearly five times the 2024 cycle
- CNA-reported election-day wagers
- More than $1.48 billion
- Kalshi election-market volume
- More than $2.5 billion this cycle, versus $1.3 billion during the 2024 election cycle
- South Carolina Senate forecast
- Markets implied a 70% chance of Darline Graham winning; Annie Andrews won
Source spectrum


Left 0 · Centre 3 · Right 0 of 3 rated sources
Background
- An earlier Lux story reported that Apple’s updated policy bars employees from using or sharing confidential work information for prediction-market trading. [78a66a25-fd44-4d8d-acc4-54367eb0bec8]
- An earlier Lux story covered midterm election wins that set representation milestones, as well as races that remained unresolved. [b26edbff-58b1-4df9-b1d4-4a2aa7a6d48d]
All coverage
Coverage over time
LeftCentreRight
Articles per hour since first reported, by side.
Ownership
- Government 33% (1)
- Unknown 33% (1)
- Non-profit 33% (1)
Share of the 3 sources by owner type.